Lipsey, M. W., Puzio, K., Yun, C., Hebert, M. A., Steinka-Fry, K., Cole, M. W., . . .Busick, M. D. (2012). Translating the statistical representation of the effects of education interventions into more readily interpretable forms (NCSER 2013-3000). Washington, DC: National Center for Special Education Research, Institute of Education Sciences.
Summary by Dr. Sarojani S. Mohammed
Overview
Many readers of academic publications want to understand the implications the studies have for their everyday practice. As teachers, when we read about an instructional practice, we want to know, ultimately, “Does it make a difference?” In an academic publication, this nugget of information is often contained within the reported effect size of an intervention; however, effect sizes are not easily interpretable and often do not convey the practical significance or applicability of an effect to practice.
This paper, published by the Institute for Education Sciences, acknowledges that “Does it make a difference?” is a common question of readers and suggests ways in which researchers can be mindful of and sensitive to this concern by reporting effects of intervention studies in more interpretable ways. The paper focuses on randomized controlled trials, in which participants are randomly assigned to either a treatment or comparison group. At the end of such a study, the means of these two groups are compared to determine the effectiveness of the intervention. Although randomized controlled trials represent a small group of studies in the education literature, the concepts described in the paper are easily transferable to quasi-experiments and other types of study designs and are useful for all readers of academic publications in which intervention effects are described. The authors do note, however, that the paper is not intended to cover observational studies.
The Many Significances of an Effect
Readers of academic publications are intimately acquainted with the term statistical significance and probably know that it is reported (as a p-value) in the results of all intervention studies. Although statistical significance tells us the extent to which the effect is likely due to chance when the null hypothesis is true, it is highly related to sample size (the larger the sample, the more likely any effect is to be statistically significant) and does not tell us about the magnitude of the effect, nor about its importance.
Because of these drawbacks, in addition to the statistical significance of an effect, researchers often also report an effect size. A standardized effect size is basically the difference between the treatment group’s mean and the comparison group’s mean, expressed in standard deviation units. In other words, a standardized effect size is the “size” of the effect, scaled in terms of the variation (or “spread”) of outcome scores. There are more descriptions of effect sizes in our November 2012, January 2013, and February 2013 columns.
To most researchers, effect size seems to be a reasonable way to describe an effect in a meaningful, comparable, interpretable way. However, a reader must make many assumptions when interpreting or comparing an effect size, unless much is known about the way in which the outcome was measured and the effect size was computed. In addition, even if the article contains sufficient detail about measurement of outcomes or the reader is comfortable enough with the assumptions to be satisfied that the reported effect size is accurate and appropriate, the reader still does not have any information about the practical magnitude of the effect. Common conventions for classifying effects as “small,” “moderate,” or “large” based solely on the value of the effect size (e.g., Cohen’s criteria, which, as the authors point out, Cohen never intended to be used as absolute criteria but are nonetheless often cited as such) compare effects across fields, content areas, and populations, thus discounting the fact that the magnitude of a reasonable, important, or expected effect may differ, depending on the circumstance.
Recommendation 1: If a standardized effect size is reported, consider which means were used to calculate the effect and which variance was used to scale it.
Most importantly, any reported effect size should be computed by using the means from the treatment and comparison groups on the outcome that is related to the intervention. If multiple outcomes were measured and reported, the one used in the effect size calculation should be the outcome that is attributable to the intervention. Plainly stated, a reading intervention study, for example, should not report a single effect size based on mathematics outcomes.
In many studies, even when participants were randomly assigned to either the treatment or comparison group, these groups were not equal to each other before the intervention began. If the groups were not equal at the beginning of the study, it doesn’t make much sense to compare the group means at the end of the study without adjusting for the inequality at the start. Researchers use covariates to adjust these group means, making them mathematically equal at the beginning of the study, so that any differences in means found at the end of the study are primarily attributable to the intervention. Similarly, it is most appropriate to use these covariate-adjusted means for each group when calculating the mean difference that is reported in the effect size.
Along the same lines, it is equally important to understand how the mean difference is scaled when reported as a standardized effect size. Basically, for the effect size to be comparable to other reported effect sizes in the same content area, and with similar populations, the standard deviation that is used to scale the effect size should be the best possible estimate the researcher has for the standard deviation of that outcome in the population. Most often, this best estimate of population standard deviation is the sample (or raw) standard deviation of the reported outcome, pooled from both treatment and comparison groups and unadjusted for any covariates. This fact is true regardless of the complexity of the variance structures estimated in the statistical analyses. If the intervention were expected to affect the variance as well as the means of the reported outcome, the best estimate of population standard deviation would be the sample standard deviation from the comparison group only.
Recommendation 2: Consider other metrics when interpreting the magnitude of an effect.
It is possible that even a standardized effect size does not answer a reader’s “Does it make a difference?” question. In some cases, different and more familiar descriptions of effects are more useful to readers. The paper describes several other effects that may be presented in an academic publication, along with the rationale and cautions for using them. These metrics are listed below with a brief explanation and guidance for their interpretation. Far more detail about each is included in the paper.
- Original metrics: Sometimes, the outcome measure of interest is well known, and readers may be familiar with the scale as well as typical means and standard deviations. In such a case, reporting an effect that represents the raw difference between the groups’ means (without scaling) might be meaningful. If a raw mean difference or a proportional difference is presented, the reader must consider the magnitude of this difference (or proportion) relative to an expected or typical difference. In other words, a difference of 3% between groups (on, say, rate of absences) may seem small at face value, but if the observed rate in the comparison group is 5% (as opposed to, say, 40%), this difference has practical implications.
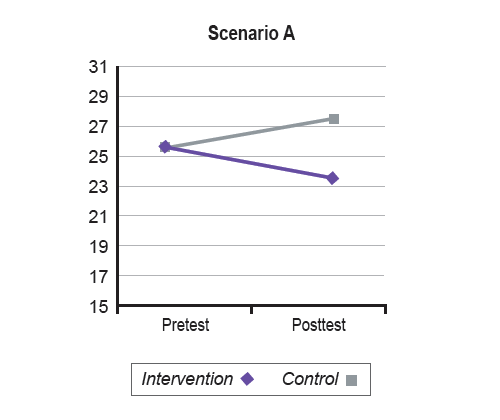
- Pre-post change: Some studies measure the outcome of interest for both groups at the start of the intervention and at the end. In such studies, it is possible to compare the raw change in scores from pretest to posttest of the treatment group to the change from pretest to posttest in the comparison group. This comparison provides much more information to the reader than a simple comparison of the means at the end of the study. For example, a posttest mean difference of 3.6 (on some outcome) between treatment and comparison groups could represent any of several patterns of change within the groups, even if groups were equivalent (or if means were adjusted for differences) at the beginning of the study. The paper illustrates this idea in Table 1 (p. 12) and Figure 1 (p. 13), which are reproduced below.
Scenario: A B C
| Pretest | Posttest | |
|---|---|---|
| Intervention | 25.5 | 23.8 |
| Control | 25.6 | 27.4 |
- Overlap in distributions: Another metric that can be as useful as a standardized effect size involves the overlap in group distributions at the end of the study. Because the overlap in distributions is proportional to the difference between the means, knowing the proportion of individuals in one group (say, the comparison group) that overlaps with the distribution of the other group (in this example, the treatment group) gives a sense of the magnitude of the effect. This overlap is determined by selecting a reference point on one of the distributions (the treatment distribution, in our example) and determining the number or proportion of individuals with a score above or below that point from the other distribution (here, the comparison). The smaller the proportion of overlap, the greater the magnitude of the effect.
- Percentiles: Similar to overlap in distributions, the magnitude of effects can be gleaned from reported percentile differences. If the mean of the treatment group is at a higher percentile rank than the mean of the comparison group, the difference in percentiles describes the magnitude of the effect. In addition, knowing the percentile ranks also provides a comparison of the performance of each group to expected or typical performance if the outcome was measured using a standardized measure because the score at the 50th percentile represents the mean score of the test norm group. Caution should be taken when interpreting percentile differences, however, as a unit increase in percentile rank does not represent a constant difference in means across the distribution (i.e., the mean difference between the 50th and 51st percentiles is not equal to the mean difference between the 95th and 96th percentiles).
- Proportions compared to criterion: Earlier, we talked about overlap of distributions as the proportion of individuals in one group that falls above or below a reference point in the other group. An effect can also be expressed as the proportion of individuals in each group that falls above or below an absolute reference (or criterion). In this situation, the most meaningful criterion or threshold is the one of highest theoretical relevance to the intervention. This criterion may be defined by using the outcome norms or other validated norms in the field, or it may be defined a priori by expert professional judgment. If all else fails, using the mean of the comparison group as the criterion makes theoretical sense because this group represents a sample of the population of interest that did not receive the intervention.
- Comparative scores: A number of scaled scores have been developed and used to give comparable estimates of the magnitude of effects. Some well-known examples include standard scores, normal curve equivalent scores, and grade equivalent scores. The benefit of these scores is that they have a known scale, so readers can get a sense of the magnitude of an effect simply by seeing the outcome mean for each group expressed in terms of these scores. These scores do have their quirks, however, which are worth keeping in mind. One disadvantage of all standard scores is that norms are generated by using a sample that is assumed to represent a population of interest. For specific studies, this norming sample may not in fact represent the population of interest.
Recommendation 3: Consider the implications of an effect as well as its magnitude.
Even when an effect is large in magnitude, numbers alone cannot describe its practical implications. To understand an effect’s implications (central to our “Does it make a difference?” question), its magnitude must be considered in the context of application. For any intervention to “matter,” the pros of implementing it in live settings must outweigh the cons. There are a number of ways to determine the pros and cons of implementing an intervention. The paper provides four frameworks for making such a determination; those frameworks are described below. It is important, though, to be careful that the populations and outcomes of interventions being compared are in fact comparable. For example, effects of high school and elementary mathematics interventions are generally not appropriate for comparison to each other, nor are effects of preschool reading and middle school reading interventions.
- Typical growth: If the magnitude of an effect does not exceed the natural effect of being in school, implementing the intervention may be unfeasible. There are several sources for determining normal growth (c.f., Bloom, Hill, Black, & Lipsey, 2008), and methods for doing so are described in detail in this paper. In general, even though an effect is a comparison between a treatment group and a group that presumably represents normal growth without the treatment, comparing the magnitude of the standardized effect size to those found for typical growth in larger, more representative samples helps to contextualize the extent to which the effect exceeds the amount of growth that would be expected for average students of the same age.
- Achievement gaps: If the population of interest in a study is a group that traditionally has lower performance than other groups, the effect may be more appropriately compared to the magnitude of the performance gap. An effect that objectively seems small in magnitude may have more practical implications if found to represent half or more of the achievement gap for the population targeted in the study.
- Other interventions: Seldom is an intervention proposed to solve a new problem, and even less frequently is it the first intervention to be proposed to solve a particular problem. The magnitude of an effect may be large at face value when compared to typical growth or even larger when compared to an achievement gap. However, the effect may not have practical implications if other interventions developed for that population and outcome repeatedly achieve effects with larger magnitudes.
- Cost-benefit: Perhaps the most practical perspective from which to evaluate the implications of an intervention’s effect is resource allocation. In terms of money, an effect size can be translated into a dollar value of benefit (such as a reduction in future cost or a return on investment), which can be directly compared with the dollar cost of implementing the intervention. Many assumptions about the dollar value of benefits (and costs, in some cases) must be made to calculate these values; the paper offers several methods for approaching this task. Ultimately, however, a reader’s “Does it make a difference?” question hinges on practical perspectives such as financial costs and benefits, so this is a useful context for considering the implications of an effect of any magnitude. An intervention that is extremely expensive but that produces large effects may ultimately not be better than a less costly intervention that achieves only moderate-sized effects.
Summary
To date, the reporting of intervention effects has been a complicated venture. Readers of academic publications are often presented with potentially inaccurate, possibly misleading numeric values, with no context for interpreting their magnitudes or implications. In recognizing this issue, the Institute of Education Sciences attempts to add to the ways in which researchers calculate and report effects, with the hope that these additions will make it easier for readers to interpret effects in meaningful ways. This paper outlines several methods in detail that researchers can use to translate effects from statistical forms to more practically meaningful forms. In doing so, it also offers guidance to readers for understanding and interpreting effects. Broadly, this guidance compels readers to consider what data would be best to use to calculate a standardized effect size, to entertain the use of nonstandard metrics (when relevant and appropriate) to describe the magnitude an effect, and to include both the magnitude and the implications of an effect when determining its practical significance or relevance to practice.
Reference
Bloom, H. S., Hill, C. J., Black, A. B., & Lipsey, M. W. (2008). Performance trajectories and performance gaps as achievement effect-size benchmarks for educational interventions. Journal of Research on Educational Effectiveness, 1(4), 289–328.