Kelley, K., & Preacher, K. J. (2012). On effect size. Psychological Methods, 17, 137–152.
Summary by Dr. Karla K. Steubing
Overview
How can we use data to make better decisions when applying research results to real-world problems? The most common way to do so in scientific research is through statistics–the “yes/no” decision to the research question of interest that null hypothesis significance testing provides. However, significance testing does not tell us about the size of an effect (Cohen, 1994). Why might it be important to know about the size of an effect? A finding that statistical testing shows to be significant might have so small an effect, or an effect that is small in relation to the effort or costs associated with obtaining it, that the finding has no practical value. On the other hand, some small effects have practical significance, based on an analysis of costs and benefits. A well-known example is the study that showed that aspirin (a low-cost treatment) could prevent an expensive and relatively rare outcome: heart attack. The effect size in this study was small by all benchmarks but was practically important because of the cost relative to the benefit (Steering Committee of the Physicians’ Health Study Research Group, 1989).
Scenario, Part I
Note: We will return to the following scenario to provide context for Kelley and Preacher’s recommendations about effect sizes.
A new intervention for teaching reading comprehension is being tested. One question of interest might be: “What is the difference in performance between students in the intervention group and students in the business-as-usual group?” Note that this example is a “How much?” research question, which contrasts with a yes/no question, such as “Is there a difference between the groups?” The benefit of a “How much?” question is that it gives a quantitative answer, which is useful when making decisions about the utility of the intervention. We can look at the size and thus the value of the gain relative to the cost of the intervention and make prudent decisions about implementation. With only a significance test as the answer to our question, we might be fairly confident that the intervention is better than business as usual, but we would not know how much better and could not perform cost/benefit analyses.
Given the practical significance of these issues, there has been a widespread push to report effect sizes (indicators of magnitude) and their confidence intervals (indicators of precision), which show a plausible range of values for the effect size, along with significance tests (Wilkinson & American Psychological Association Task Force on Statistical Inference, 1999). Despite this trend, there are multiple definitions of effect size.
The paper by Kelley and Preacher is an attempt to think more broadly about effect size. One of the authors’ key points is that it is necessary to tie explicitly any effect size to the research question. The article is useful to us as researchers because it clarifies the calculation and interpretation of effect sizes. The article is just as important to us as practitioners and thoughtful consumers of research because it helps us better understand research reports and provides a richer understanding about not only whether an intervention has “significant” effects, but also how useful or practicable those effects might be.
Defining Effect Size
Kelley and Preacher define effect size as “a quantitative reflection of the magnitude of some phenomenon that is used for the purpose of addressing a question of interest” (2012, p. 140). The authors elaborate by describing the following three characteristics to take into account when considering effect sizes.
- Dimension. This term refers to the characteristic of the data that is central to the research question of interest. Kelley and Preacher list central tendency, variability, association, difference, odds, rate, duration, discrepancy, and proportionality as potential research question dimensions. Some dimensions are more useful or important to researchers than others, depending on the purpose of the study. Consumers of research findings need to consider whether a dimension of a reported effect allows them to use the research results. For example, if a researcher and reader want to know whether a treatment results in better performance than another approach, a difference in mean performance between the treatment and comparison groups is the dimension likely to be most useful. Or if the researcher and reader want to know whether a given treatment has differential effects for different students, the degree of variability in the treatment sample relative to the comparison sample might be the dimension of interest. In a third case, the key outcome might be the likelihood of passing the year-end reading test. In this case, the dimension of the relevant effect size would be odds, perhaps compared across groups in an odds ratio. For example, children in the intervention group might be twice as likely as children in the comparison group to pass the year-end reading test.
- Measure. This term refers to the equation the researcher has chosen to represent the dimension he or she has chosen to investigate. The selection of a measure is not arbitrary; it should best answer the research question. For example, if we wanted to know the amount of change in our outcome (e.g., a reading comprehension score) relative to the amount of change in our predictor (e.g., hours of instruction), we would choose regression weight as an effect size. If the two variables were measured in meaningful units (e.g., predictor measured in hours of instruction and outcome measured in number of students passing the year-end test), the unstandardized regression weight might be most informative.
- Value. This term refers to the real number obtained when applying the measure to the data.
Scenario, Part II
Recall that we want to estimate the difference (our dimension) between the intervention group and the business-as-usual group. We might choose Cohen’s d as our measure, transferring the data from our study into the equation for d. The quantitative result we obtain (e.g., 0.4) is the value of the effect size that we report. Frequently, practitioners will interpret this effect size by referring to Cohen’s rules of thumb for small, medium, and large effects, despite the fact that Cohen said his rules should not be used for this purpose. He recommended, and we agree, that an effect size must be interpreted in the context of the research design, which includes the cost to obtain the effect and the value of the outcome. The result of d = 0.4 can mean different things-for example, when it indicates an improvement of comprehension of 0.4 passages for each hour of instruction versus for each month of instruction.
An effect size familiar to many educators is Cohen’s d (or its unbiased counterpart, Hedges’ g, used most notably by the Institute of Education Sciences What Works Clearinghouse), which is used to quantify differences between groups of subjects. Another familiar effect size is the correlation coefficient, r, which quantifies the association between two variables.
The Standardization Corollary
Kelley and Preacher also developed 10 corollaries, or implications, that stem from the global definition of effect size and the three characteristics described above. Here, we focus on corollary 4: “Effect sizes can be standardized, partially standardized, or unstandardized.” Standardization refers to the scale of the effect size that is reported. Standardized effects are reported in standard deviation units. Unstandardized effects are reported in the units of whatever assessment was used to calculate the effect. Both Cohen’s d/Hedges’ g and the correlation coefficient, r , can be standardized effect size measures if the original scale of the scores is re-expressed in the standard deviation units found in the given sample. For example, a standardized Hedges’ g with a value of 0.40 means that the treatment group outscored the comparison group by 0.40 of the standard deviation of the sample. Both of these measures consider two dimensions simultaneously (mean difference and variability in the case of Cohen’s d, covariance and variability in the case of a correlation coefficient), so effect size values can vary across studies due to researcher decisions about sample selection. The true degree of association may be the same across a set of samples, but if one researcher restricts variability by selecting an extreme group and another researcher looks at the association across the whole distribution of scores, different correlations will be observed (Baguley, 2009). Increasingly, researchers argue for reporting unstandardized effect sizes for the sake of interpretability (Baguley, 2009).
Example
Torgesen et al. (2001) present an example of an unstandardized effect size by displaying the results of multiple reading intervention studies. The effect sizes they present involve only one dimension (gain). The measure of effect size they used was the pretest-posttest difference in a standardized reading score (measured before and after the intervention) divided by the number of hours of instruction. The values of the effect sizes are presented in the table below.
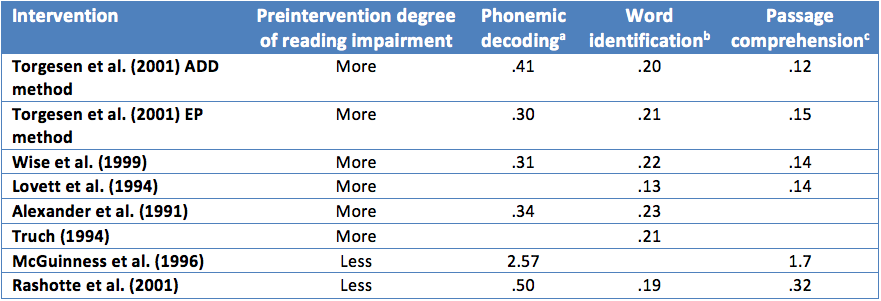 Note: Adapted from Torgesen et al. (2001), Table 10.
aAbility to read pronounceable nonwords (e.g., blive); bability to read real English words; cability to fill in the missing word in a short passage of text to demonstrate understanding.
This unstandardized effect size allows readers to interpret the amount of gain within the context of their experience. For example, with 20 hours of instruction, children in the Torgesen et al. (2001) study who used the ADD method gained, on average, about 9 standard scores on a test of phonemic decoding. A student that started with a standard score of 80, representing performance at the 9th percentile, would, after 20 hours of instruction, end up with a standard score of 89, representing performance at the 23rd percentile. Findings expressed in this way are easily interpretable and meaningful. Common usage of the standard score scale (mean = 100 and SD = 15) provides a benchmark against which other interventions can be tested. Additionally, this effect size can be used in cost/benefit analyses because it comprises two relatively concrete quantities. The input is hours of instruction, and the output is gain in standard reading units. Policymakers can determine whether the number of points of expected gain is worth the cost of the additional hours of instruction. As the above examples and review hopefully convey, effect sizes are an increasingly important complement to statistical null hypothesis tests and are useful in elaborating results of research studies. Although many effect sizes are reported in the literature, both researchers and consumers of research benefit from considering effect size dimensions, measures, and values within the context of the research’s purpose.
References
Alexander, A., Anderson, H., Heilman, P. C., Voeller, K. S., & Torgesen, J. K. (1991). Phonological awareness training and remediation of analytic decoding deficits in a group of severe dyslexics. Annals of Dyslexia, 41, 193-206.
Baguley, T. (2009). Standardized or simple effect size: What should be reported? British Journal of Psychology, 100, 603-617.
Cohen, J. (1994). The earth is round (p < .05). American Psychologist, 49, 997-1003.
Lovett, M. W., Borden, S. L., Lacerenza, L., Benson, N. J., & Brackstone, D. (1994). Treating the core deficits of developmental dyslexia: Evidence of transfer of learning after phonologically and strategy-based reading training programs. Journal of Educational Psychology, 30, 805-822.
McGuiness, C., McGuiness, D., & McGuiness, G. (1996). Phono-Graphix: A new method for remediating reading difficulties. Annals of Dyslexia, 46, 73-96.
Rashotte, C. A., MacPhee, K., & Torgesen, J. K. (2001). The effectiveness of a group reading instruction program with poor readers in multiple grades. Learning Disability Quarterly, 24(2), 119-134.
Steering Committee of the Physicians’ Health Study Research Group. (1989). Final report on the aspirin component of the ongoing Physicians’ Health Study. New England Journal of Medicine, 321, 129-135.
Torgesen, J. K., Alexander, A. W., Wagner, R. K., Rashotte, C. A., Voeller, K. K. S., & Conway, T. (2001). Intensive remedial Instruction for children with severe reading disabilities: Immediate and long-term outcomes from two instructional approaches. Journal of Learning Disabilities, 34, 33-58, 78.
Truch, S. (1994). Stimulating basic reading processes using Auditory Discrimination in Depth. Annals of Dyslexia, 44, 60-80.
Wilkinson, L., & American Psychological Task Force on Statistical Inference. (1999). Statistical methods in psychology journals: Guidelines and explanations. American Psychologist, 54, 594-604.
Wise, B. W., Ring, J., & Olson, R. K. (1999). Training phonological awareness with and without explicit attention to articulation. Journal of Experimental Child Psychology, 72, 271-304.