Johnson, E. S., Jenkins, J. R., Petscher, Y., & Catts, H. W. (2009). How can we improve the accuracy of screening instruments? Learning Disabilities Research and Practice, 24, 174–185.
Summary by Dr. Amy E. Barth
Overview
The purpose of screening in response to intervention (RTI) models is to identify students who are likely to struggle in core (or tier 1) instructional settings. Screening may occur at any point during the school year but frequently occurs at the beginning of the year or at the end of the first semester. An ideal screening measure is easy to administer, score, and interpret; relatively inexpensive; brief; and beneficial to students. Most importantly, screening classifies at-risk students and not-at-risk students. By identifying at-risk students, particularly in kindergarten and grade 1, practitioners can initiate tier 2 intervention to prevent later reading difficulties. No screening measure is 100% perfect. Consequently, schools must weigh the cost of over-identifying versus under-identifying at-risk students.
Study Purpose
The purpose of this study was to examine the classification accuracy of several Dynamic Indicators of Basic Early Literacy Skills (DIBELS) subtests and to evaluate how to improve classification accuracy among a sample of 12,055 first-grade students. Indices commonly used to describe screening accuracy include: (a) sensitivity, (b) specificity, (c) classification accuracy, and (d) area under the curve. Sensitivity and specificity are outcomes that can be manipulated, depending on base rates and purpose. (See the table below for an example of how to calculate each statistic.)
- (a) Sensitivity represents the percentage of students classified as “struggling readers” on the end-of-year reading test who were correctly identified as “at risk.” The goal is 90% sensitivity.
- (b) Specificity represents the percentage of students classified as “skilled readers” on the end-of-year reading text who were correctly classified as “not at risk.” The goal is 90% specificity.
- (c) Classification accuracy represents the percentage of at-risk and not-at-risk students correctly classified.
- (d) Area under the curve represents information about the specificity and sensitivity of a screening by using values that range from 0 to 1.0, with 1.0 meaning “reliably distinguishing all at-risk and not-at-risk students.”
Summary of Study Results
1. What grade 1 end-of-year reading outcome measure best predicted performance on grade 3 end-of-year state accountability tests?
The study compared three end-of-year reading outcomes (DIBELS Oral Reading Fluency [ORF], Peabody Picture Vocabulary Test [PPVT], and SAT-10). Results revealed that the SAT-10 was the strongest predictor of performance on the grade 3 state accountability reading test.
Recommendation 1: Select a grade 1 criterion measure that closely aligns (has strong predictive validity) with the state’s grade 3 reading assessment.
Recommendation 2: If your school selects the ORF as the grade 1 end-of-year criterion, keep in mind that it does not directly measure reading comprehension ability and represents a proxy for performance on a more comprehensive assessment of reading (Deno, 1985; Fuchs et al., 2001). Teachers also should not inappropriately narrow their instruction—the ORF directly assesses word reading accuracy and fluency, not reading comprehension or language comprehension (Pearson, 2006).
2. What was the utility of DIBELS screening measures in predicting grade 1 outcomes?
This study compared the utility of three DIBELS subtests in kindergarten (Nonsense Word Fluency [NWF], Phoneme Segmentation Fluency [PSF], and Initial Sound Fluency [ISF]) and in first grade (ORF, NWF, and PSF) in predicting end-of-year grade 1 SAT-10 performance. To identify a minimum of 90% of at-risk students, sensitivity was held constant at 90%. Results revealed that NWF was the most accurate kindergarten screening and that ORF was the most accurate first-grade screening. However, specificity rates were 69% for kindergarten NWF and 52% for grade 1 ORF, suggesting that these measures over-identified a significant number of students, who failed the screening but later passed the SAT-10 (false positives).
Recommendation 3: The first job of a screener is to identify the majority of at-risk students. To do so, set the sensitivity of the measure high.
3. Did combining screening measures reduce false positives, thereby improving the screening’s specificity?
As previously discussed, setting sensitivity high caused the kindergarten NWF and grade 1 ORF to over-identify as being at risk students who later performed successfully on the end-of-year outcome measure (false positives). To improve classification accuracy, this study evaluated whether using multiple screening measures reduced classification errors. Results suggest that classification accuracy in kindergarten improved by using NWF + ISF or NWF + PPVT. In grade 1, classification accuracy improved by using ORF + PSF, ORF + NWF, or ORF + PPVT.
Recommendation 4: Use multiple measures to improve the classification accuracy of a single screening measure.
Recommendation 5: Reduce over-identification by progress monitoring at-risk readers for 4–8 weeks following screening and using rate of growth and level of reading performance to classify students as being at risk or not at risk.
4. Do subgroups such as English language learners and students receiving free or reduced-price lunch require different cut scores from their peers to identify at-risk students with 90% accuracy?
This study examined whether to adjust the cut points used to identify 90% of at-risk readers to accurately classify English language learners and students receiving free or reduced-priced lunch. Results indicate that scores should be lowered to achieve a sensitivity rate of 90%.
Recommendation 6: Schools with diverse populations of students should evaluate whether the cut points to identify at-risk readers of the majority population are appropriate for minority populations.
In summary, grade 1 ORF was the strongest predictor of end-of-year grade 1 reading achievement. However, when ORF cut scores were set to ensure that most at-risk students were identified (90% sensitivity), very high rates of over-identification resulted. This result may be due to floor effects (Catts et al., 2012). Classification accuracy can be improved by using multiple measures. Classification accuracy among English language learners and students who receive free or reduced-price lunch can be improved by lowering the cut score.
Example
The example below uses data from Table 2 on page 180 of the article to demonstrate how the classification accuracy statistics were calculated.
A sample of 12,055 first-grade students were universally screened, using DIBELS ORF, at the beginning of the school year. Sensitivity was set at 90% to ensure that 90% of at-risk students were identified (this is equivalent to a cut score of 18 words correct/minute).
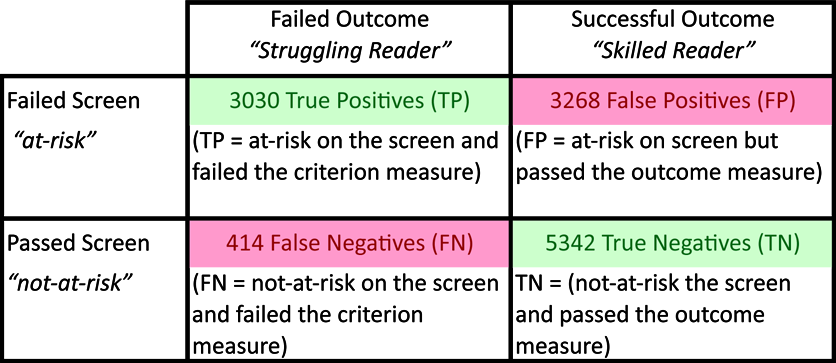
Sensitivity: TP / (TP + FN)
3,030 / (3,030 + 414) = 90%
Specificity: TN / (TN + FP)
5,342 / (5,342 + 3,268) = 59%
Classification accuracy: (TP + TN) / (TP + FP + FN + TN)
(3,030 + 5,342) / (3,030 + 3,268 + 414 + 5,342) = 69%
Area under the curve: .830
Cut score: 6 18 words correct per minute
As a contrast, if you change the cut score to only 6 words correct/minute using the dropdown menu above, you can see that sensitivity falls; while specificity and classification accuracy both increase.
References
Catts, H. W., Petscher, Y., Schatschneider, C., Sittner Bridges, M., & Mendoza, K. (under review). Getting off the floor with universal screening.
Deno, S. L. (1985). Curriculum-based measurement: The emerging alternative. Exceptional Children, 52, 219–232.
Fuchs, L. S., Fuchs, D., Hosp, M., & Jenkins, J. R. (2001). Oral reading fluency as an indicator of reading competence: A theoretical, empirical, and historical analysis. Scientific Studies of Reading, 5, 239–256.
Pearson, P. D. (2006). Foreword. In K. S. Goodman (Ed.), The truth about DIBELS: What it is, what it does. Portsmouth, NH: Heinemann.